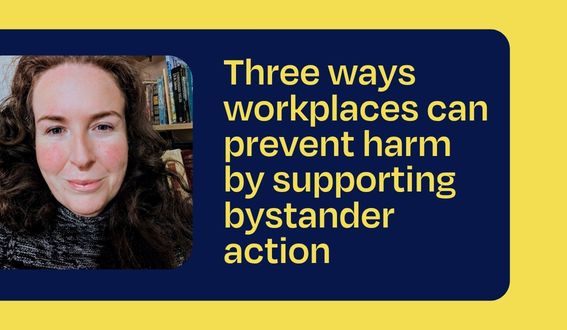
Inclusion@Work Index

What is the Inclusion@Work Index?

DCA developed the first Inclusion@Work Index survey in 2017 to map the state of inclusion in the Australian workforce. Since then, we have repeated the survey biennially to track workplace inclusion over time. Now in its 4th iteration, DCA set out to investigate 2 questions:

1. How inclusive is the Australian workforce for a diversity of employees, and how has this changed over time? 

2. How exclusive is the Australian workforce for a diversity of employees, and how has this changed over time? 

To do this, DCA surveyed a nationally representative sample of 3000 workers in Australia.

Map of Australia Icon

Our aspiration is to:

Why does Inclusion@Work matter?

Inclusion@Work is good for people

Each Inclusion@Work Index demonstrates that inclusion is much more than a “feel good” exercise – it creates a better work environment that boosts employee wellbeing, fuels performance and minimises risk. Employees who form part of inclusive teams experience several benefits, especially in contrast to employees in non-inclusive teams. A similar trend also happens for inclusive managers and inclusive organisations– the more inclusive our managers and organisation, the more satisfied, secure, and successful we are.  

Job Satisfaction

Workers in inclusive teams are 10 times more likely to be very satisfied than workers in non-inclusive teams.

Mental Health

Workers in inclusive teams are 4 times more likely to feel work has a positive impact on their mental health.

Turnover

Workers in inclusive teams are 3 times less likely to leave their organisation than those in non-inclusive teams.

Feedback

Workers in inclusive teams are 2.5 times more likely to have been given feedback that they found useful.

Inclusion@Work is good for business

The Inclusion@Work Index consistently shows a strong link between inclusion at work and team performance, with similar results for inclusive managers and inclusive organisations. So, if your organisation is looking to create high-performing teams, it’s time to start investing in building Inclusion@Work.

Innovation

Inclusive teams are 9.5 times more likely to be innovative than non-inclusive teams.

Teamwork

Inclusive teams are 8.5 times more likely to work together effectively.

Customer Service

Inclusive teams are 4 times more likely to provide excellent customer service.

Motivation

Inclusive teams are 2.5 times more likely to have members willing work extra hard to help their team succeed.

Want to Explore the State of D&I in Your Organisation?

Participate in the Inclusive Employer Index

Are you wanting to explore diversity and inclusion in your workforce, but not sure where to start? Every year, Australian organisations are able to participate in DCA’s Inclusive Employer Index, which enables them to measure and benchmark a range of diversity and inclusion data in their workforce. Participating organisations receive their results on an easy-to-use dashboard that takes the work out of D&I data collection.   

Organisations that participate in the Inclusive Employer Index, if deemed eligible, are able to show their commitment to diversity and inclusion by displaying a time-dated Inclusive Employer logo.

Want to learn more? Access the research

Since 2017, DCA has published a biennial Inclusion@Work Index report based on the latest data on inclusion in Australian workplaces. See our reports below to explore trends, developments and insights in this ever-evolving area.

Related Research

Artwork for the Case for Inclusion@Work from DCA's 2023-2024 Inclusion@Work Index
Special Edition Report: The Case for Inclusion@Work
Mapping the state of inclusion and mental health in the Australian workforce report artwork
Report: Mapping the State of Inclusion and Mental Health in the Australian Workforce
""
Special Edition Report: Mapping the State of Flex in the Australian Workforce
""
Report: Class at Work

INCLUSION@WORK INDEX logo is a Registered Trade Mark of Diversity Council Australia Limited.