What is the Inclusion@Work Index?
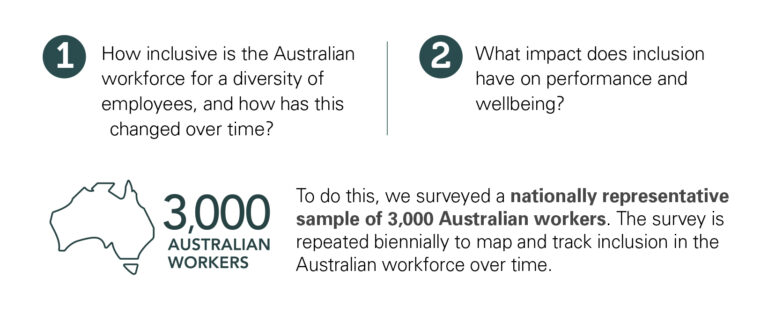
In 2017 DCA partnered with Suncorp, and in 2019 Suncorp and Novartis created a national Inclusion@Work Index to track the state of inclusion in Australian workplaces over time. Now in its third iteration, DCA once again investigated 2 questions:
Our aspiration is to:
- encourage Australian organisations to achieve inclusion in their workplaces
- biennially track Australia’s progress (or lack of) in creating Inclusion@Work, and
- encourage Australians to consider workplace inclusion for a broad set of workers – that is, not just workplace inclusion for men and women (most commonly considered by employers) but also by age, cultural background, caring responsibilities, disability status, Indigeneity, sexual orientation and gender identity, and more.
Explore the Findings
Support for Diversity & Inclusion
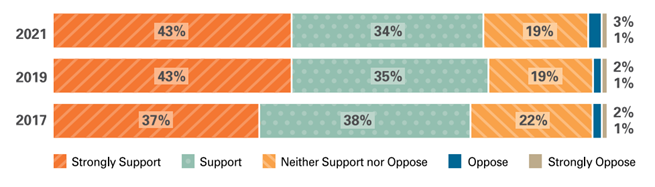
To what extent do workers support or oppose their organisation taking action to create a diverse and inclusive workplace?
Our research shows that Australian workers overwhelmingly support inclusion initiatives. In 2021, as in 2017 and 2019, three out of four Australian workers supported or strongly supported their organisation taking action to create a workplace that is diverse and inclusive (D&I) and only 3% of Australian workers opposed or strongly opposed their organisation taking action.
The State of Exclusion
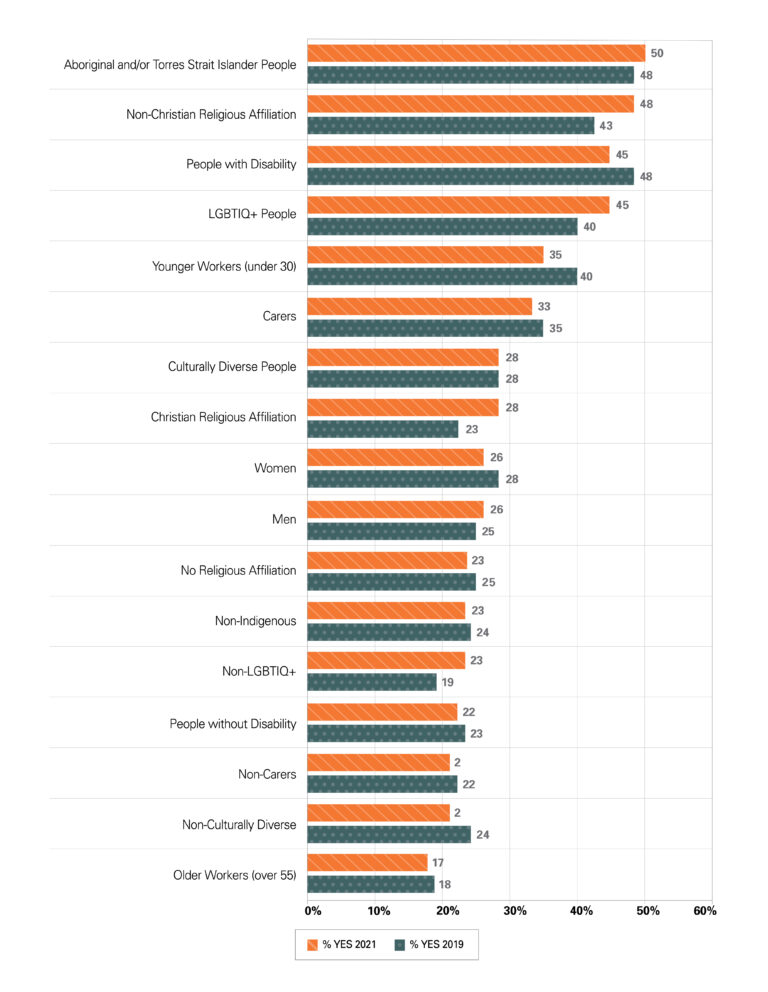
Discrimination and harassment in the workplace are common – over a quarter of workers still report personally witnessing and/or experiencing discrimination and/or harassment, and everyday exclusionary behaviours the workplace.
Each index we find workers from minority groups are significantly more likely to experience discrimination and/or harassment at work compared to workers from mainstream or majority groups.
Aboriginal and/or Torres Strait Islander workers consistently report the highest levels of exclusion. With 1 in 2 reporting experiencing some form of discrimination and/or harassment in the past year, they were twice as likely as non-Indigenous workers to have experienced discrimination and/or harassment at work in the last 12 months.
Workers from a non-Christian religious background, workers with disability and LGBTIQ+ workers also report significantly higher levels of experience of discrimination and/or harassment, compared to Christian workers, workers with no religion, workers without disability and non-LGBTIQ+ workers.
Leading and Lagging Industries
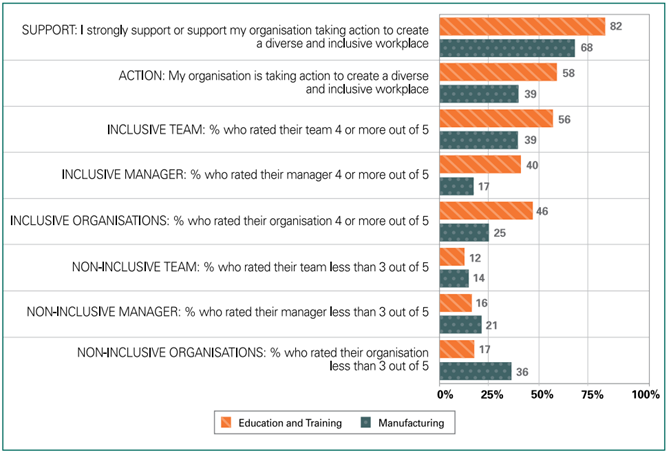
In both 2017 and 2019, financial and insurance services was the leading industry for Inclusion@Work. This year saw a change – workers in education and training are now the most likely to report experiencing Inclusion@Work.
The education and training industry has one of the highest levels of reported organisational D&I activity and employee support for this, one of the highest percentages of employees working in inclusive teams and organisations and with inclusive managers, and the greatest overall workforce diversity relative to the Australian workforce average.
Meanwhile, for the third index in a row, workers in manufacturing were significantly less likely to experience Inclusion@Work. The industry has a low level of reported organisational D&I activity and employee support for this, a low percentage of inclusive teams, organisations and managers, and a high percentage of employees working in non-inclusive teams and organisations and with non-inclusive managers.
Access the Research
For a 2-page summary on why Inclusion@Work is important for Australian workplaces, please download the Infographic
For more information on the key findings, please download the Synopsis Report
For more detailed information on all findings, the research methodology, and all research references, please download the Full Report. DCA members can access the Full Report by logging into the Members Only area of the DCA website.
INCLUSION@WORK INDEX logo is a Registered Trade Mark of Diversity Council Australia Limited.
Inclusion@Work Case Study
In 2017 DCA and Suncorp joined forces to create a national Inclusion@Work Index to track the state of inclusion in Australian workplaces over time. In the case study below, Founding Sponsor, Suncorp shares their experience of creating Inclusion@Work in practice.
Methodology
The findings reported on in this website are based on the nationally representative on-line 2021-2022 Inclusion@Work survey of 3000 Australian workers (except where otherwise indicated).
The methodology is described in full detail in the Inclusion@Work Index Full Report, available on DCA website (see above).
LGBTIQ+
- 3% Strongly Oppose
- 2% Oppose
- 12% Neither Oppose nor Support
- 29% Support
- 54% Strongly Support
Non-LGBTIQ+
- 1% Strongly Oppose
- 2% Oppose
- 18% Neither Oppose nor Support
- 34% Support
- 44% Strongly Support
Aboriginal and/or Torres Strait Islander
- 3% Strongly Oppose
- 2% Oppose
- 12% Neither Oppose nor Support
- 36% Support
- 47% Strongly Support
Non-Indigenous
- 1% Strongly Oppose
- 2% Oppose
- 18% Neither Oppose nor Support
- 34% Support
- 45% Strongly Support
Under 30 Years
- 1% Strongly Oppose
- 3% Oppose
- 17% Neither Oppose nor Support
- 30% Support
- 48% Strongly Support
Mid-Career (30-54)
- 1% Strongly Oppose
- 2% Oppose
- 17% Neither Oppose nor Support
- 35% Support
- 44% Strongly Support
55+ Years
- 2% Strongly Oppose
- 2% Oppose
- 21% Neither Oppose nor Support
- 34% Support
- 41% Strongly Support
Women
- 1% Strongly Oppose
- 1% Oppose
- 15% Neither Oppose nor Support
- 33% Support
- 50% Strongly Support
Men
- 2% Strongly Oppose
- 3% Oppose
- 21% Neither Oppose nor Support
- 35% Support
- 39% Strongly Support
People With Disability
- 3% Strongly Oppose
- 2% Oppose
- 16% Neither Oppose nor Support
- 34% Support
- 45% Strongly Support
People Without Disability
- 1% Strongly Oppose
- 2% Oppose
- 18% Neither Oppose nor Support
- 34% Support
- 45% Strongly Support
Carers
- 2% Strongly Oppose
- 2% Oppose
- 16% Neither Oppose nor Support
- 35% Support
- 46% Strongly Support
Non-Carers
- 1% Strongly Oppose
- 2% Oppose
- 19% Neither Oppose nor Support
- 33% Support
- 44% Strongly Support
Culturally Diverse
- 2% Strongly Oppose
- 2% Oppose
- 17% Neither Oppose nor Support
- 33% Support
- 47% Strongly Support
Non-Culturally Diverse
- 1% Strongly Oppose
- 3% Oppose
- 18% Neither Oppose nor Support
- 35% Support
- 44% Strongly Support
Flex Workers
- 1% Strongly Oppose
- 2% Oppose
- 15% Neither Oppose nor Support
- 33% Support
- 49% Strongly Support
Non-Flex Workers
- 2% Strongly Oppose
- 2% Oppose
- 23% Neither Oppose nor Support
- 36% Support
- 37% Strongly Support
Non-Christian Religious Affiliation
- 2% Strongly Oppose
- 2% Oppose
- 21% Neither Oppose nor Support
- 25% Support
- 50% Strongly Support
Christian Religious Affiliation
- 1% Strongly Oppose
- 3% Oppose
- 17% Neither Oppose nor Support
- 36% Support
- 43% Strongly Support
No Religious Affiliation
- 2% Strongly Oppose
- 2% Oppose
- 18% Neither Oppose nor Support
- 33% Support
- 46% Strongly Support
Managerial Level
- 2% Strongly Oppose
- 3% Oppose
- 17% Neither Oppose nor Support
- 35% Support
- 45% Strongly Support
Non-Managerial Level
- 1% Strongly Oppose
- 2% Oppose
- 19% Neither Oppose nor Support
- 33% Support
- 45% Strongly Support